Why Charging Full Market Rent Can Be a Poor Cash-Flow Decision
A $50 monthly rent gap might seem insignificant on a single single-family rental. But if rents fall an additional $50 per month behind market each year across a 10-property portfolio, the cumulative gross-revenue loss reaches $90,000 over five years.
However, recognizing the danger of compounding rent lag does not mean every property should automatically be pushed to the highest rent the market will bear.
For sophisticated portfolio owners, the primary objective is rarely maximum theoretical market rent. The real objective is durable, uninterrupted net cash flow.
A recent lease renewal for one of our four-bedroom single-family properties illustrates how we navigate this balance using data, behavioral psychology, and clear risk modeling.
The Single-Property Decision
When evaluating an upcoming renewal for a single-family asset occupied by a reliable tenant for 4.75 years (57 months), our property manager proposed a 6.5% rent increase.
While a 6.5% bump was higher than their typical 3.5% baseline, we elected not to treat a preset percentage formula as a decision rule. Instead, we evaluated the property’s specific market position, operating expense history, tenant tenure, and potential turnover costs.
The Baseline Metrics
Current Rent: $1,550 / month
PM Standard Baseline Rate: ~3.5%
PM Proposal (+6.5%): $1,650 / month
Our Target Renewal Rent:$1,695 / month (+9.4%)
Estimated Open-Market Rent: $1,795 / month
Tenant Tenure: 4.75 years (57 months)
A $1,695 renewal offer represents a 9.4% increase over current rent while positioning the property at approximately 94% of its estimated open-market ceiling.
This approach reflects our Retention-Based Market Rent (RBMR) strategy: targeting a rent rate slightly below full market value to maintain portfolio-market alignment while providing an established, high-quality tenant a tangible economic incentive to stay.
How the "COVID Inflation Squeeze" Created Rent Lag
To understand why a 9.4% increase was necessary, it helps to review the property's historical performance.
Like many rental housing providers navigating the economic uncertainty of 2021 through 2023, we held this tenant’s rent flat at $1,350 per month for three consecutive years.
Holding rent static supported tenant stability during a volatile period. However, non-discretionary operating expenses did not remain flat:
Property Taxes climbed with updated assessments.
Property Insurance premiums increased significantly.
Maintenance Labor & Materials experienced persistent inflationary pressure.
Holding rent flat doesn't eliminate expense inflation; it simply postpones revenue adjustments. If the gap between income and non-discretionary expense growth becomes too wide, ownership eventually faces a difficult dilemma: accept permanently compressed cash flow or impose a sharp, disruptive rent reset.
This property had reached a point where a routine 3.5% or even 6.5% percentage adjustment would fail to correct the accumulated rent lag.
Analyzing Behavioral Risk: The "Sticker Shock" Threshold
When setting renewal pricing, portfolio management becomes an exercise in human psychology. To evaluate the risk of a 9.4% increase, we consider tenant response behavior across three distinct magnitude zones:
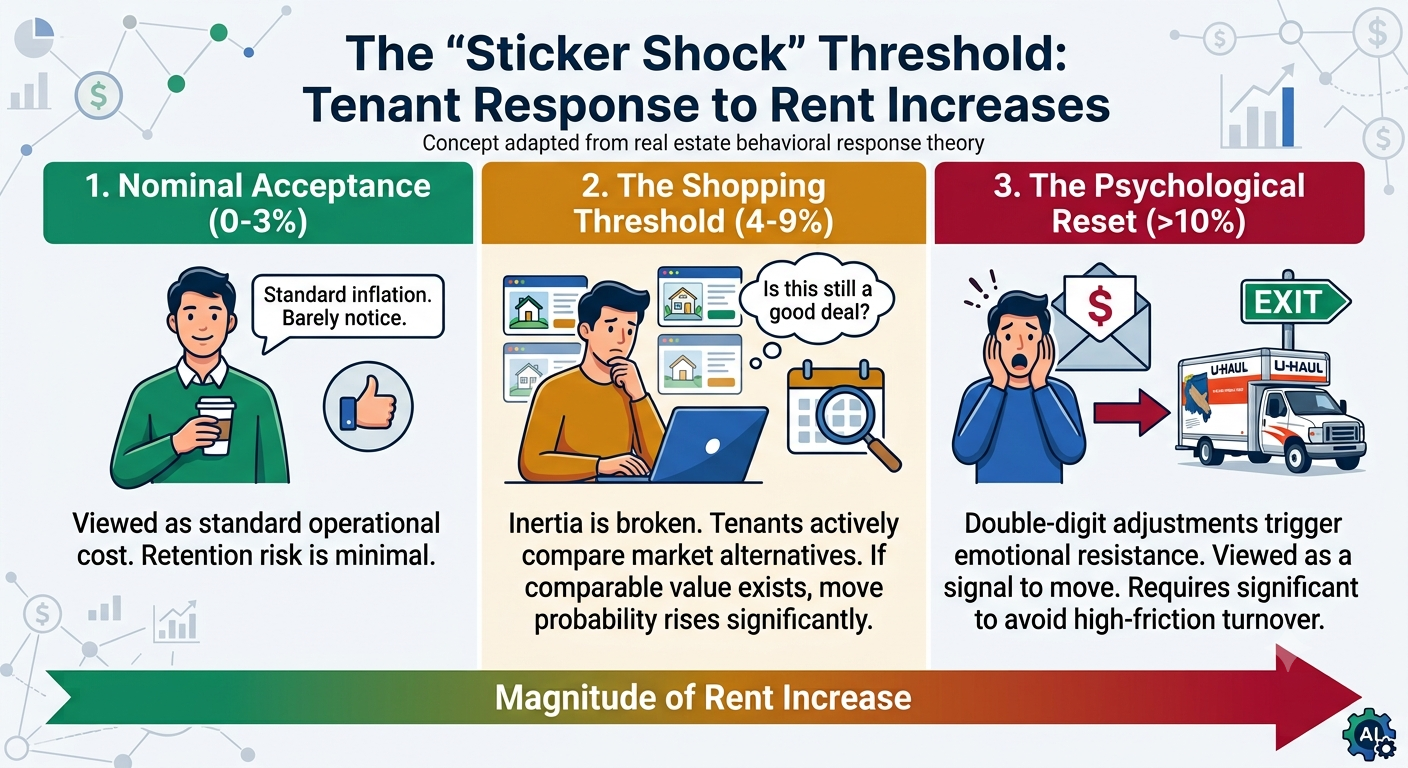
Nominal Acceptance (0–3%): Generally viewed as standard inflation. Retention risk is minimal.
The Shopping Threshold (4–9%): Inertia breaks. The tenant actively checks local listings to ask, "Is this still a good deal?"
The Psychological Reset (>10%): Double-digit adjustments trigger emotional resistance and act as an explicit signal to start packing.
Our target of $1,695 (+9.4%) intentionally sits at the upper boundary of Zone 2.
Pushing all the way to full open-market rent ($1,795) would have required a 15.8% increase, forcing a 57-month tenant straight into Zone 3 (The Psychological Reset) and dramatically increasing the probability of a turnover.
Quantifying Turnover Cost vs. Revenue Recovery
The core flaw in chasing "top of market" rent is failing to account for turnover friction.
The gap between our $1,695 target and the $1,795 full market ceiling is $100 per month ($1,200 per year). Leaving that $100 on the table serves as our "tenant retention insurance premium."
The Math Behind Turnover Risk
If demanding that additional $100/month triggers a move-out:
Vacancy Cost: A single month of vacancy ($1,795) requires 18 months of higher rent just to break even.
Turnover Friction: Adding leasing fees, turnover prep, and paint/cleaning costs can push the financial recovery period beyond 24 to 30 months.
In real estate operations, an advertised listing price can be higher while the owner’s actual realized cash flow ends up significantly lower.
Why Rent Drift Compounds: The $90,000 Portfolio Reality
While avoiding unnecessary turnover is critical, avoiding necessary rent adjustments out of fear is equally damaging.
If 10 properties fall an additional $50 per month behind market each year, the cumulative gross revenue loss reaches $90,000 over five years.
This compounding effect demonstrates why portfolio owners cannot rely indefinitely on preset percentage formulas. A percentage increase describes the size of a change, but it does not determine the correct market destination.
Execution and Contingency Planning
Using AI-assisted data tools, we benchmarked our asset against active inventory within a 5-mile radius. Finding a restricted supply of comparable four-bedroom single-family homes in this price tier confirmed that $1,695 still represented a strong value proposition for the tenant.
We approved the renewal offer at $1,695 per month.
Plan B: The Capital Improvement Contingency
A disciplined operating strategy always includes a structured plan if a renewal offer is declined:
If the tenant chooses to vacate, we will initiate Plan B:
Execute a targeted kitchen refresh from our capital improvement plan.
Re-assess active market data post-improvement.
Re-list the property at an estimated $1,950 / month target (supported by local 12-month median comp data of $2,025 for 4-bedroom rentals).
The Operating Takeaway
Durable cash flow requires portfolio owners to actively balance seven distinct variables:
· Current Market Evidence
· Property Condition & Layout
· Non-Discretionary Inflation
· Historical Rent Lag
· Tenant Tenure & Reliability
· Turnover & Opportunity Costs
· Long-Term Portfolio Objectives
Setting rent at $1,695 was not an arbitrary compromise between an aggressive owner and a conservative property manager. It was the result of objectively defining the asset's market position to secure the highest probability of stable, long-term net income.
Maximum theoretical rent and maximum realized cash flow are rarely the same number. Managing the distance between them is where portfolio value is created.
